By type of space
Last 24 months, for steadier medians · per sq ft per year · base rent + avg NNN asking now
$20.61 + $7.37 NNN · asking $20.00
$12.00 + $3.13 NNN · asking $8.95
$17.25 + $4.55 NNN † · asking $21.25
$11.10 †
Commercial · City of Missoula
What space leases for, what buildings sell for, and how long both take. Updated every month from the MLS, with ten years of history. Leasing, buying, selling or developing, start here.
The short version · October 2026
By Jeremy Williams, broker, Bannack Real Estate
Data through October 2026 · updated November 22, 2026
Leasing
City of Missoula · 12 months to October 2026 · compared with the 12 months before
Last 24 months, for steadier medians · per sq ft per year · base rent + avg NNN asking now
$20.61 + $7.37 NNN · asking $20.00
$12.00 + $3.13 NNN · asking $8.95
$17.25 + $4.55 NNN † · asking $21.25
$11.10 †
Last 24 months · median rate per sq ft per year, and the typical monthly rent
$23.45 · about $900 a month · 104 days to lease
$17.40 · about $2,049 a month · 105 days to lease
$14.94 · about $3,290 a month · 78 days to lease
$16.25 · about $4,100 a month · 208 days to lease
$13.25 † · about $7,358 a month · 170 days to lease
Lease rates are the rate recorded on each leased MLS listing, converted to a yearly rate per square foot. † Fewer than 5 leases: read as a rough guide.
NNN vs. gross
On a triple-net (NNN) lease the tenant also pays a share of property taxes, insurance and common-area costs. In Missoula that charge has averaged $5.22 per square foot per year (median $4.56) on top of base rent, and spaces for lease right now ask a median of $7.25. Compare a gross lease to base rent plus NNN, not to base rent alone.
The MLS has no lease-type field, so NNN leases and charges are read from each listing's public description. Treat these as estimates.
| Lease type | Leases | Average base / sq ft / yr | Median |
|---|---|---|---|
| NNN leases | 23 | $15.69 | $15.17 |
| Gross or full-service leases | 13 | $21.43 | $19.54 |
| Lease type not stated | 66 | $20.90 | $18.12 |
| NNN charge, by use | Listings | Average / sq ft / yr | Median |
|---|---|---|---|
| All listings that state an NNN charge | 25 | $5.22 | $4.56 |
| Office / medical | 12 | $7.37 | $6.84 |
| Retail / restaurant / service | 2 | $4.55 † | $4.55 |
| Industrial / warehouse / storage | 9 | $3.13 | $2.68 |
Buying & selling buildings
City of Missoula · 12 months to October 2026 · compared with the 12 months before
Sellers are giving ground. Buildings took a median of 225 days to sell (up from 102), and there are about 23.7 months of supply on the market. That's good news for a buyer with a plan, and a reason for an owner to price on today's sales, not last year's asking prices.
Last 24 months, for steadier medians · for sale now as of October 2026
| Use | Sold | Median price | Per building sq ft | Days on market | For sale now | Months of supply |
|---|---|---|---|---|---|---|
| Office / medical | 25 | $590,000 | $322.43 | 91 | 22 | 21.1 |
| Industrial / warehouse / storage | 15 | $825,000 | $178.40 | 242 | 22 | 35.2 |
| Retail / restaurant / service | 12 | $745,000 | $241.89 | 184 | 9 | 18 |
| Residential / lodging | 4 | $1,675,000 | $141.81 † | 98 | 1 | 6 |
| Other / mixed | 10 | $1,312,500 | $182.54 | 221 | 4 | 9.6 |
Last 24 months
| Building | Sold | Median price | Per building sq ft | Days on market | For sale now |
|---|---|---|---|---|---|
| Under 2,500 sq ft | 31 | $399,900 | $325.80 | 91 | 18 |
| 2,500–5,000 sq ft | 10 | $593,862 | $173.34 | 185 | 23 |
| 5,000–10,000 sq ft | 18 | $1,197,500 | $168.75 | 230 | 13 |
| 10,000–25,000 sq ft | 5 | $2,280,000 | $136.43 | 154 | 12 |
| 25,000+ sq ft | 2 | $4,223,500 | $123.59 † | 250 | 4 |
Sales of commercial property recorded in the MLS. Use comes from the MLS Current Use field, or the listing description when it's blank. Smaller buildings sell for more per square foot, so the overall price per square foot moves with the mix that sold. † Fewer than 5 sales.
By location & type
12 months to October 2026 · for lease and for sale as of October 2026 · general location by ZIP code
Location moves the rent more than anything. Leases downtown & north of the river signed at a median of $22.02 per sq ft per year, against $12.70 out by Reserve, Mullan and the airport, where most of the industrial and warehouse space is. For buyers, the most choice is along Reserve, Mullan and by the airport, with 35 properties for sale.
Downtown core, Northside, Westside, Rattlesnake · ZIP 59802
$22.02 + $5.22 NNN · asking $12.26
$22.80 + $7.37 NNN · asking $16.50
Too few leases for a median · asking $9.90
$15.20 + $4.55 NNN †
University, Hip Strip, Midtown, Brooks & Russell · ZIP 59801
$19.27 + $5.22 NNN · asking $18.00
$20.16 + $7.37 NNN · asking $18.00
Too few leases for a median
$18.62 + $4.55 NNN †
North Reserve, Mullan Road, Grant Creek, the airport · ZIP 59808
$12.70 + $5.22 NNN · asking $20.00
$12.80 + $7.37 NNN · asking $20.00
$7.96 + $3.13 NNN · asking $10.54
Too few leases for a median
South Hills, Miller Creek, Target Range, Orchard Homes · ZIP 59803, 59804
Too few leases for a median
No leases or listings
Downtown core, Northside, Westside, Rattlesnake · ZIP 59802
$278 per sq ft · asking $240
$333 per sq ft
Too few sales for a median
Too few sales for a median · asking $325
University, Hip Strip, Midtown, Brooks & Russell · ZIP 59801
$168 per sq ft · asking $227
Too few sales for a median · asking $218
Too few sales for a median
$285 per sq ft · asking $174
North Reserve, Mullan Road, Grant Creek, the airport · ZIP 59808
$205 per sq ft · asking $214
$205 per sq ft · asking $416
$137 per sq ft · asking $209
Too few sales for a median
South Hills, Miller Creek, Target Range, Orchard Homes · ZIP 59803, 59804
Too few sales for a median · asking $282
Too few sales for a median
No sales or listings
Too few sales for a median
A median shows once there are at least 3 leases or sales. The NNN charge is the citywide average for that type of space, read from listing descriptions (the MLS has no NNN field), so it is an estimate and applies only if the lease is NNN; gross leases already include these costs. † Only a few listings state it. "All types" also counts listings with another or no stated use. Commercial deals are few, so one building can move a number: call me for the comparables behind any cell.

Development land
City of Missoula land & lots · 12 months to October 2026 · compared with the 12 months before
Ten years
Median rate per sq ft per year on commercial leases, by year · *2026 is January through October
Median sale price per building sq ft, by year · *2026 is January through October
| Year | Leases | Lease rate / sq ft / yr | Buildings sold | Median sale price | Per building sq ft | Sale days on market |
|---|---|---|---|---|---|---|
| 2016 | 53 | $12.50 | 45 | $462,500 | $107.50 | 189 |
| 2017 | 56 | $12.00 | 52 | $527,500 | $112.68 | 174 |
| 2018 | 56 | $13.33 | 53 | $550,000 | $119.79 | 122 |
| 2019 | 53 | $13.79 | 36 | $567,500 | $123.60 | 136 |
| 2020 | 47 | $13.67 | 37 | $480,000 | $192.31 | 205 |
| 2021 | 71 | $13.53 | 63 | $595,750 | $180.39 | 144 |
| 2022 | 55 | $15.03 | 37 | $651,192 | $266.02 | 149 |
| 2023 | 49 | $15.00 | 29 | $851,000 | $210.26 | 157 |
| 2024 | 52 | $17.26 | 23 | $1,100,000 | $279.19 | 84 |
| 2025 | 54 | $18.00 | 35 | $725,000 | $246.24 | 137 |
| 2026* | 50 | $17.08 | 35 | $750,000 | $195.64 | 208 |
For sale & for lease
Call or text me for pricing, a brochure or a tour. For everything else on the market, search all commercial listings below.
Development land · Missoula
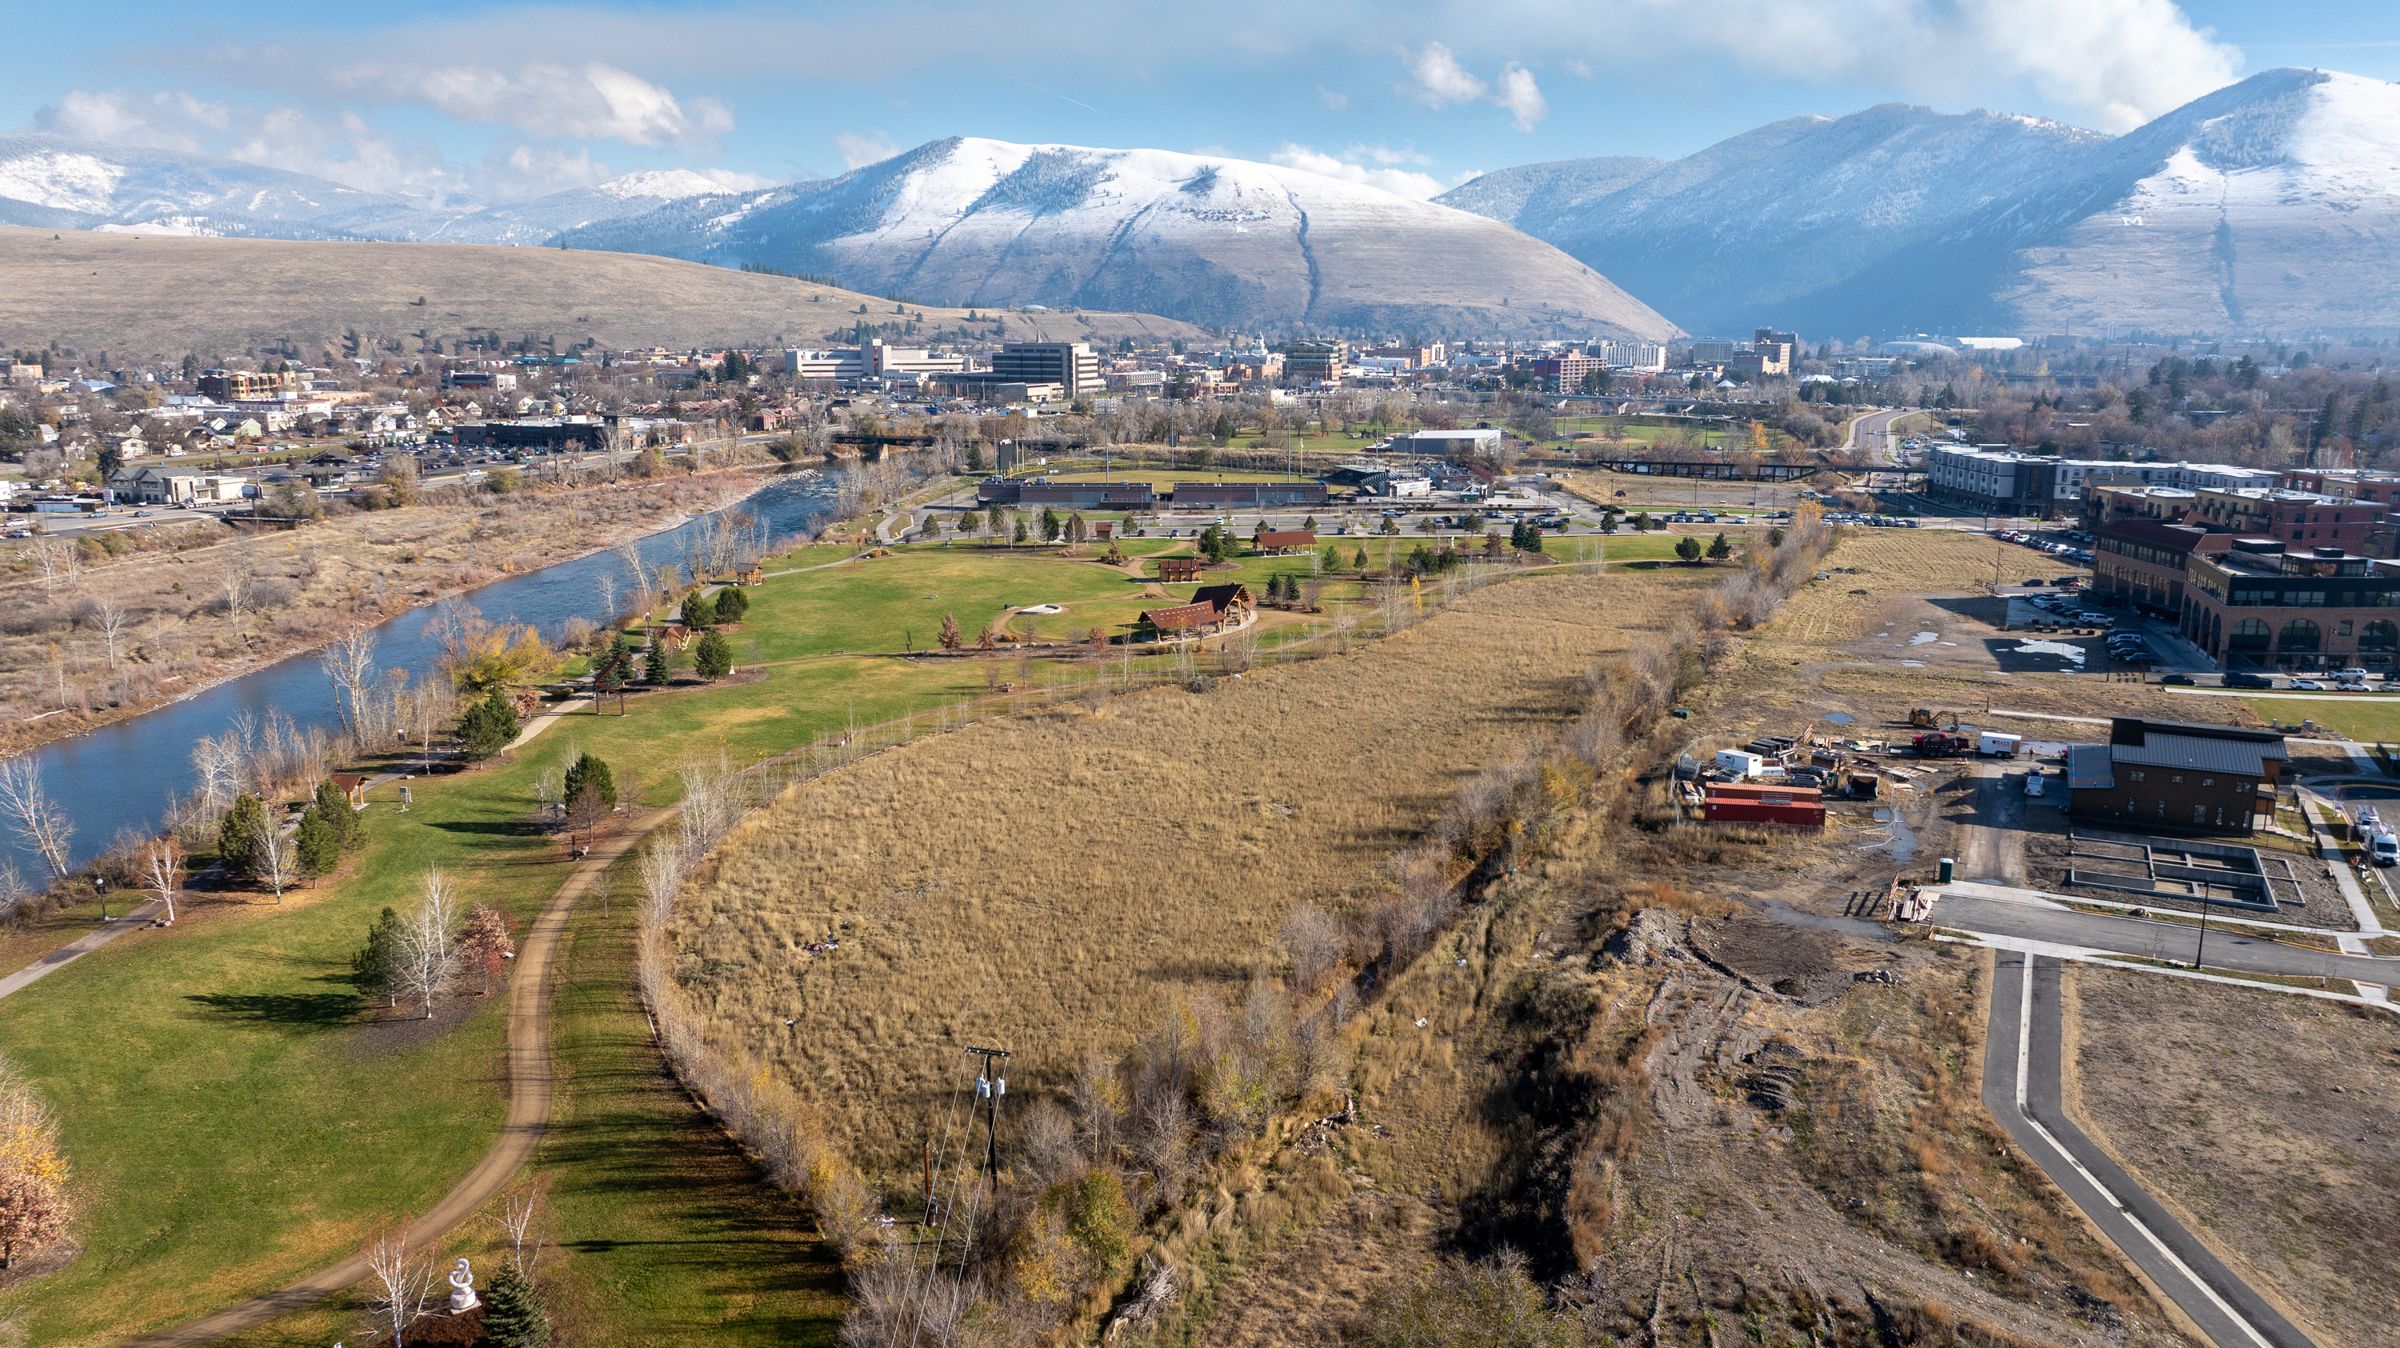
The last open land in the Old Sawmill District: 11.0 acres on a 46-acre former mill site beside Silver Park and Ogren Park, about half a mile from downtown Missoula. Five offerings, sold separately or together.
Questions
Over the 12 months to October 2026, commercial space in the City of Missoula leased for a median of $17.50 per square foot per year, based on 58 leases in the Montana Regional MLS. Over the last 24 months, office and medical space ran higher ($20.61), and industrial and warehouse space lower ($12.00).
Listings that state an NNN charge show a median of $4.56 per square foot per year on top of base rent. Spaces for lease right now ask a median of $7.25. The MLS has no lease-type field, so these come from the wording in each listing and are estimates.
The median was 118 days on the market over the 12 months to October 2026. There are about 9.7 months of supply at the current pace, with 47 spaces listed for lease.
38 commercial properties sold in the City of Missoula in the 12 months to October 2026, at a median of $750,000 and $186.41 per building square foot. Buildings sold for a median 92.2% of their original asking price after 225 days on the market. Price per square foot swings with which buildings sell, so compare by use and size.
Over the 12 months to October 2026, leases downtown & north of the river (ZIP 59802) signed at the highest median rate, $22.02 per square foot per year. The lowest was reserve, mullan & the airport (ZIP 59808) at $12.70, where more of the space is industrial and warehouse.
For sales, buyers have room: 75 buildings are for sale, about 23.7 months of supply, and 51% of them have cut their price. Leasing is tighter, at about 9.7 months of supply.
City of Missoula, from Montana Regional MLS listings summarized by Bannack Real Estate Group. Leases and sales not entered in the MLS aren't included. Updated monthly; figures through October 2026.
Talk commercial
Tell me what you're working on. I'll reply personally with the comparable leases or sales for your space or building, and what I'd do next.
Rather talk now? Call or text 406-531-1519